

By Randal O’Toole, The Antiplanner
Editor’s Note: The NMA has received permission to post this report on recent findings on traffic safety in the US. Check out Part 1 here.
Transit Safety
In her recent report, NBC News journalist Erin Sagen betrays an anti-auto bias when using such terms as “carnage” and “auto dependency.”
Americans are not dependent on autos: they are liberated by them, enjoying far greater mobility than anyone else, anywhere else, in the entire history of humanity.
That mobility has made us wealthy and given us access to, among other things, better health care. While every traffic fatality is a tragedy, and we should try to use evidence-based systems to reduce such tragedies, one reason why Americans seem to Sagen to be “nonchalant” about traffic safety is that we get so much from automobiles and highways.
One way to see this is to compare transit safety with automobile safety. According to the most recent report from the Federal Transit Administration, between 2011 and 2019, an average of more than 275 people per year were killed in transit-related accidents.
While that seems small compared with the average of 17,500 people killed per year in urban traffic accidents, transit also produced proportionately smaller benefits in those years. During those years, Americans traveled an average of 55 billion passenger-miles a year by urban transit, while they traveled 3.6 trillion passenger-miles a year by motor vehicles on urban roads and streets.
This means that transit accidents killed an average of 5.0 people per billion passenger-miles while urban traffic accidents killed 4.9 people per billion. Yet, few people decry the “carnage” caused by transit dependency.
While highway safety has mostly improved over the years, transit safety has, at best, remained stagnant. Changes in fatalities appear to be due more to the changing reporting requirements than to improved or worsened safety. Reports show that fatalities significantly declined in 2002, then slowly grew again.
The Federal Transit Administration says that the drop in 2002 resulted from a change in reporting requirements, which “may have resulted in unreliable data in that year.” While the agency claims that “the reliability of reporting is believed to be much better in 2003 and is expected to improve in the future,” it took until 2019 before reported fatalities reached what they had been before 2002.
If transit was no safer in 2019 than it was in 2001, then it seems likely that fatalities were underreported in the intervening years. Just as the pandemic has led to a higher traffic fatalities and rates, it has also worsened transit fatalities and rates.
The Federal Railroad Administration monitors and regulates commuter train safety, which hasn’t yet reported the 2020 or 2021 fatalities. But of the remaining forms of transit, 2020 fatalities were 8.6 percent greater than in 2019, and 2021 fatalities are on track to being 5.8 percent greater than in 2020.
With the huge decline in transit ridership, this pushed the fatality rate to 15.7 per billion passenger-miles in 2020 and 16.5 so far in 2021 (and the addition of commuter rail is likely to make it higher still).
Before the pandemic, the most dangerous form of urban transit was light rail, which killed more than 17 people per billion passenger-miles between 2011 and 2019, a number that increased to more than 43 in 2020 and the first half of 2021. The light-rail line in Houston was involved in so many collisions with automobiles that it became locally known as the “wham-bam tram.”
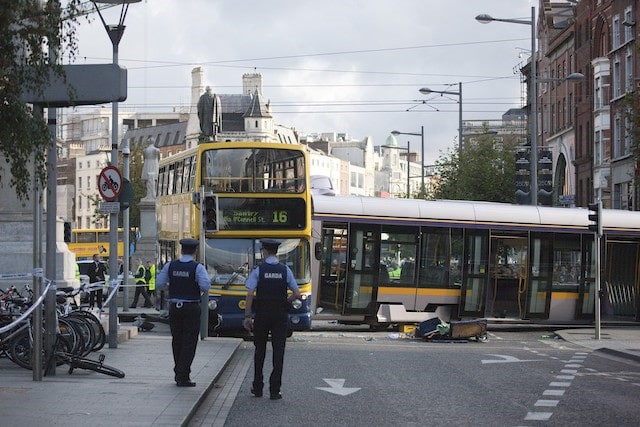
This collision of a light-rail train and bus in Dublin injured 21 people, three of them seriously. Light rail makes no sense when buses can safely carry more people for less money. Photo by William Murphy.
Streetcars weren’t as dangerous as light rail before the pandemic, but they killed nearly 50 people per billion passenger-miles in 2020 and 2021. Of course, streetcars moved only 60 million passenger-miles in 2020 and 2021 together, but the three people they killed in those years represent a higher fatality rate than any other form of transit.
These numbers include suicides, which transit agencies would like to exclude because they “aren’t the transit systems’ fault.” But just as bridge designers can and should make bridges safe from suicides using fencing and nets, transit designers should also make their systems safe.
For heavy rail, this means putting up platform walls with doors that open when trains are in the stations, as is done in the Chengdu Metro. For light rail, the best solution is not to build it and to replace existing lines with buses, as buses are much safer and can move more people per hour for a much lower cost.
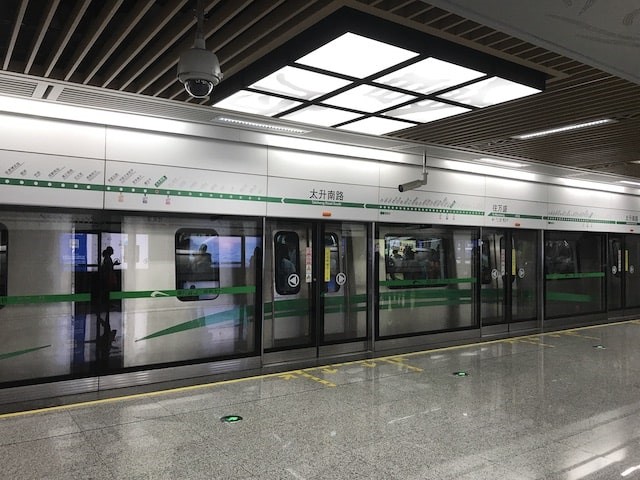
The Chengdu Metro has clear walls and doors that protect passengers from suicide or accidentally falling onto tracks. Photo by Asuracd.
In short, when measured per billion passenger-miles, transit was slightly less safe than other motor vehicles before the pandemic and considerably less safe during the pandemic. I say this not to excuse motor vehicle fatalities but only to say that anyone concerned about one should be just as concerned about the other.
Advocates of transit expansion who claim they want to make roads safer by getting people out of their cars will need to explain how building light-rail lines that kill three times as many people per billion passenger-miles, as urban roads will make transportation any safer.
The Airline Safety Success Story
Those who genuinely care about transportation safety, and aren’t just using it to bludgeon one form of transportation or another, should learn a lesson from the airline industry.
During the 1990s, US airlines suffered 34 fatal crashes that killed 931 people.
As reported in an April 2021 issue of The Wall Street Journal, a group of airline and airplane manufacturer executives, government regulators, and pilot-union leaders responded by developing a data-driven incident reporting system that focused on fixing problems–not on blaming problems on individual errors or oversights.
“Government and industry experts extracted safety lessons by analyzing huge volumes of flight data and combing through tens of thousands of detailed reports filed annually by pilots and, eventually, mechanics and air-traffic controllers,” reported the Journal.
“Responses led to voluntary industry improvements, rather than mandatory government regulations.” Improved aircraft played a major role. “Cockpit automation provided stronger safeguards against crew errors,” says the Journal.
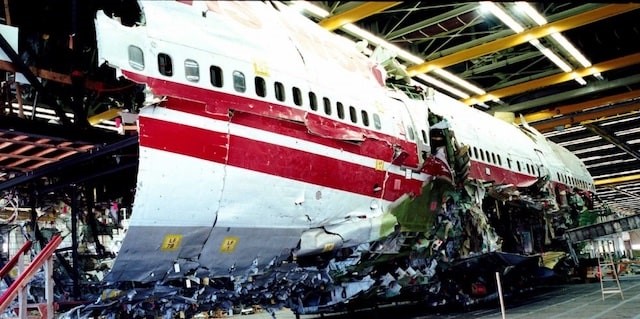
The 1996 crash of TWA flight 800, which killed 230 people, helped persuade the airline industry to work with federal regulators and pilots to create a data-driven incident-reporting system to improve the safety of air travel. National Transportation Safety Board photo.
The results can be seen in the 2010s, during which there were only four fatal commercial airline incidents that killed just 16 people. Considering that the airlines carried more than 6.3 trillion passenger miles during that time, this is a remarkable record of just 0.0025 fatalities per billion passenger miles.
Part 3 of this report focuses on data-driven safety and how that can be better utilized to make fundamental changes so that every road user is safer.
Randal O’Toole, The Antiplanner, is an economist with forty-five years of experience critiquing public land, urban, transportation, and other government plans.