

By Randal O’Toole, writer of The Antiplanner
Editor’s Note: Check out Part 1 here that explores what happened with transit before and during the pandemic. The NMA is reprinting with permission this post that first appeared on The Antiplanner website.
Transit by Urban Area
As of December, transit carried 58 percent of pre-pandemic riders in the New York urban area, indicating that transit there is recovering slightly faster than in the rest of the country. New York is really the only transit-dependent urban area in the nation, and more than 45 percent of December transit riders were in that area.
Some areas did much better than New York: transit in Tampa-St. Petersburg actually reached 72 percent of pre-pandemic numbers. Transit carried 60 to 70 percent of 2019 numbers in Los Angeles, Miami, Dallas, Houston, San Diego, Las Vegas, Cincinnati, Orlando, Milwaukee, Austin, Providence, Salt Lake City, and Nashville. The relaxation of COVID lockdowns in Florida, Texas, and some other states influenced some of these numbers, but mode was also important: in many of these urban areas, all or nearly all transit is buses, not rail.
At the other extreme, transit in Detroit, Memphis, and New Orleans still carried fewer than 40 percent December 2019 riders, while transit in Chicago, Philadelphia, Washington, Atlanta, San Francisco-Oakland, Minneapolis-St. Paul, Riverside, Sacramento, San Jose, and Charlotte carried less than half of pre-pandemic riders. In between, where transit carried 50 to 60 percent of 2019 riders, were (in addition to New York), Boston, Phoenix, Seattle, Denver, Baltimore, St. Louis, Portland, Cleveland, San Antonio, Pittsburgh, Indianapolis, Columbus, and Jacksonville.
Transit Service
To help transit survive the pandemic, Congress gave transit agencies $25 billion in April 2020, most of which was presumably spent during 2020. In December Congress added another $14 billion followed by $30.5 billion more in March 2021. These funds allowed transit to operate 83 percent as much transit service, measured in vehicle-miles of travel, in 2021 as in 2019.
A few minor transit modes, such as San Francisco cable cars, monorails, streetcars, and aerial trams, saw much larger cutbacks, probably because these are more aimed at tourists than commuters and other local users. But conventional buses and subways operated at 90 percent, bus-rapid transit routes at 93 percent, light rail at 86 percent, and hybrid rail (Diesel-powered light rail) at 92 percent of pre-pandemic service.
Like other businesses, many transit agencies complain they are having a difficult time finding employees to operate transit vehicles. Despite claims that this is an “emergency,” most transit agencies had stepped up service by December, when they operated 86 percent as many vehicle-miles as in December 2019, up from 83 percent for 2021 as a whole. Thus, low ridership can’t be blamed on driver shortages or other causes of poor service.
Transit Disasters
Some transit systems stand out as being particularly hard hit by the pandemic. As of December, commuter trains in Minneapolis still carried less than 10 percent of pre-pandemic numbers. Commuter trains in Los Angeles, San Francisco, Seattle, and northern Virginia were less than 25 percent of 2019 riders while Maryland and Nashville commuter trains were under 30 percent.
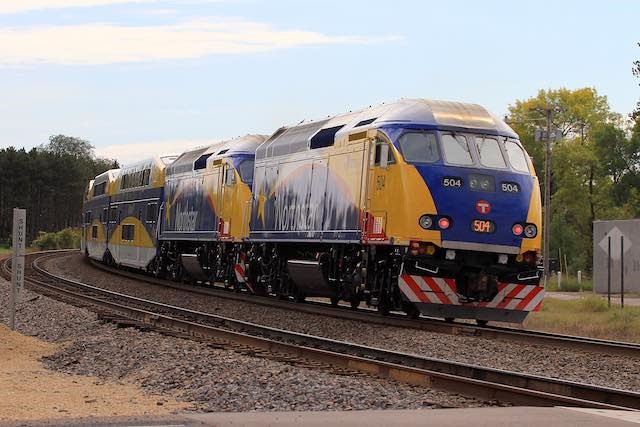 Minnesota’s North Star: perhaps the worst-performing transit line in the country. Photo by Michael Hicks.
The San Francisco BART system was under 25 percent of 2019 numbers, while heavy-rail systems in Baltimore and Washington were only around 30 percent. Light-rail systems did a little better but were only around a third of pre-pandemic numbers in Pittsburgh and San Jose, and were less than half in Baltimore, Boston, Charlotte, Cleveland, Denver, Minneapolis, Portland, Sacramento, and San Francisco.
Lessons
Congress expected that most of the nearly $70 billion in COVID relief funds for transit agencies would be spent on operations, but some of the money could be spent on capital improvements. To this, Congress added another $40 billion in the infrastructure bill, which is all to be spent on capital improvements or replacement of worn-out infrastructure.
Ridership numbers offer some lessons on where these funds can be spent most effectively. Most important, any project that aims to get high-income downtown workers out of their cars is almost certain to be a waste. Those workers will be fewer in number, they will be less likely to live on transit lines, and there will be less congestion to discourage them from driving. In addition, the world is changing so fast that the lengthy times required to plan and build new infrastructure almost guarantees that such infrastructure will be obsolete before it opens for business.
Instead of blowing the money on expensive, downtown-oriented transit projects that are unlikely to attract many riders, transit agencies should take this opportunity to reinvent themselves so they can serve more people. One simple way would be to increase frequencies on existing routes that are already heavily used.
More drastically, agencies need to recognize that central city downtowns are no longer the significant job centers they once were. Before the pandemic, demographer Wendell Cox calculated that, only 20 percent of the New York metro area’s jobs were in midtown or downtown Manhattan. This was, in fact, the best case: in the nation’s 54 largest urban areas outside of New York City, only 6.5 percent of jobs were in the downtown areas.
Many metro areas have other job centers, sometimes called edge cities, that have as many or more jobs as their downtowns. In an earlier analysis, Cox identified more than two dozen edge cities around Los Angeles that had more than 20,000 jobs each, several of which had more jobs than downtown Los Angeles. While downtown Los Angeles had about 137,000 jobs, the edge cities had more than 2 million jobs. Yet these areas are poorly served by transit: at the time of Cox’s analysis, more than 22 percent of downtown Los Angeles workers took transit to work, while the highest for any of L.A.’s edge cities was under 12 percent and the average was just 5 percent.
Transit systems work better in downtowns because they are hub-and-spoke systems bringing people in from many areas. As described in a previous policy brief, transit can better serve other job centers by creating systems with multiple hubs, with spokes radiating from each hub to most or all the other hubs. This is easily possible because most edge cities are at the intersections of two major freeways or highways, so buses can easily travel between job centers on those freeways or highways.
Ending the Waste
The nation’s taxpayers have wasted an enormous amount of money building transit systems aimed at attracting people out of their cars. Most of these systems didn’t work, and the pandemic has undone any of the benefits some of them were able to achieve.
While the pandemic seems never-ending, what is really happening is we are trending towards a New Normal that will be different in many ways from what people considered normal before 2020. The New Normal will have more people working at home and fewer people commuting on any given day. More people will live in more remote areas. More jobs will be in suburban or other low-density areas. Roads will be less congested, providing less of an incentive for people to ride transit. Fewer people will be willing to risk infectious diseases by riding mass transportation systems that are slower, less convenient, and more expensive than driving a personal automobile.
Transit agencies have a choice: they can use the opportunity to use the influx of funds provided by the infrastructure bill to reinvent themselves to meet the needs of this New Normal or they can continue to follow their historic path of planning for downtown-centric cities of the early twentieth century. Sadly, I suspect most will follow the latter course.
I’ve posted an enhanced spreadsheet of monthly transit ridership data. FTA’s raw transit data are in cells A1 through IO2244. Annual totals are in columns IP through JI, mode totals in rows 2247 through 2268, agency totals in rows 2275 through 3274, and totals for all urban areas are in rows 3280 through 3768. Columns JJ and JK show December 2021 numbers as a percent of December 2019 and December 2020. Columns JL and JM show 2021 as a percent of 2019 and 2020. All of these enhancements are on both the UPT (unlinked passenger trips) and VRM (vehicle-revenue miles) worksheets.
Randal O’Toole, writer of The Antiplanner website, is an economist with forty-five years of experience critiquing public land, urban, transportation, and other government plans.