
By Randal O’Toole, writer of The Antiplanner
Editor’s Note: The NMA is reprinting with permission this post that first appeared on The Antiplanner website.
Despite receiving tens of billions of dollars in support from Congress, the transit industry in 2021 failed to recover most of the riders it lost to the pandemic in 2020. Ridership in 2020 had fallen by 54 percent from 2019 due to the pandemic, and was only 3 percent greater, or 52 percent below 2019 numbers, in 2021, according to data released by the Federal Transit Administration in January 2022.
Ridership did improve over the pandemic months of 2020, but not by much. The year 2020 ended with ridership at 38 percent of pre-pandemic levels. It reached 50 percent for the first time in July 2021, slowly climbed to 55 percent in September, and hovered around 55 to 57 percent for the rest of the year.

Transit’s recovery continues to lag behind other modes of travel.
Transit ridership in December 2021 was 56 percent of December 2019 numbers. This is preliminary and the final number is likely to be slightly higher, but transit is still the slowest to recover of major modes of travel: Amtrak carried 69 percent and the airlines 84 percent of pre-pandemic numbers in December. Numbers for December driving are not yet available, but November driving was 103 percent of pre-pandemic miles.
Before the Pandemic
To understand how the pandemic affected the transit industry, it is helpful to know how the industry was changing before the pandemic. Ridership had been declining since 2014, but most of that decline was in buses, which lost 12 percent of their riders between 2014 and 2019 compared with just 2 percent for rail transit. Annual bus ridership exceeded rail ridership in every year from 1947 through 2015, but due to the fall in bus ridership, rail ridership exceeded bus ridership in every year since 2016.
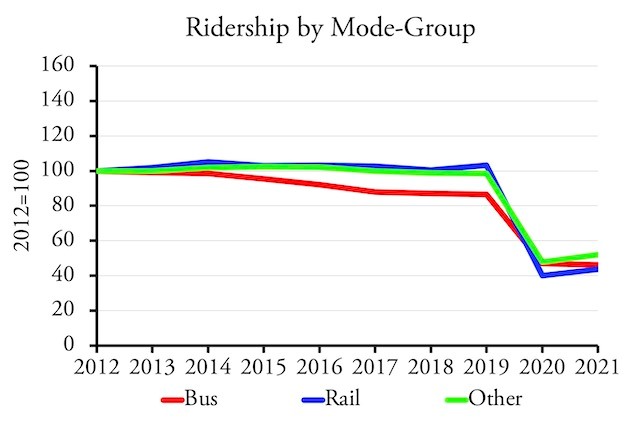
Prior to the pandemic, bus ridership was falling faster than rail ridership. “Bus” includes commuter bus, conventional bus, bus- rapid transit, and trolley bus. “Rail” includes commuter, light, heavy, and hybrid rail (meaning Diesel-powered light rail). “Other” includes demand response and minor modes such as monorails and aerial trams.
The decline in bus ridership reflected a decline in fuel prices, which led many low-income transit riders to buy cars. Since only 5.2 percent of low-income workers commuted by transit in 2014, a small increase in auto ownership rates could translate into a large decline in transit ridership.
Meanwhile, companies like Amazon were locating large numbers of office employees in downtown areas, hoping to attract young workers who supposedly preferred to take transit to work. This led to a significant boost in ridership in Seattle, which was expanding its light-rail system, as well as a few other cities that relied heavily on rail transit. Repairs of the New York and Washington subway systems also helped offset some of the declines in heavy-rail ridership, which had fallen by seven percent between 2014 and 2018 but recovered a majority of that loss in 2019.
Using data from the 2017 National Household Travel Survey, researchers from the University of South Florida found that most rail commuters had incomes well above $50,000 a year while most bus commuters had incomes well below $50,000 a year.
High-income rail commuters were more likely to have access to automobiles and more likely to work downtown than low-income bus commuters. While many low-income transit commuters chose transit because they lacked access to an automobile, high-income commuters chose transit mainly to avoid downtown congestion.
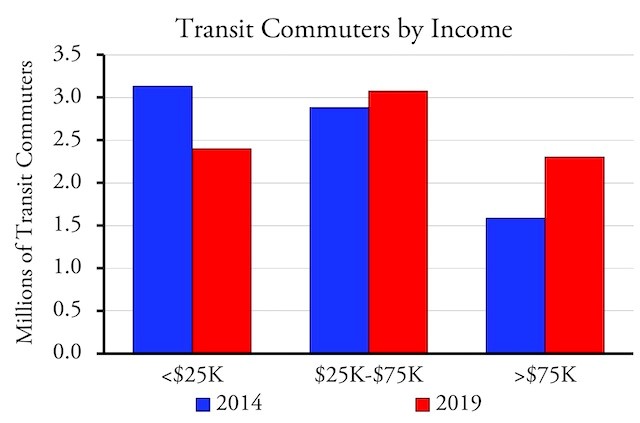
Prior to the pandemic, low-income transit commuting was declining and transit’s biggest growth market was people earning more than $75,000 a year–people who are now most likely to work at home.
With the decline in low-income bus riders, high-income commuters were transit’s main growth market after 2014. According to the Census Bureau’s American Community Survey, between 2014 and 2019, transit lost 733,000 commuters who earned under $25,000 a year, but gained 715,000 commuters who earned more than $75,000 a year.
Effects of the Pandemic
What is especially bad news for the transit industry is that these high-income riders were the ones most likely to work at home during and after the pandemic. Rail ridership, as a share of pre-pandemic numbers, has consistently lagged behind bus ridership and in December was only 52 percent of December 2019 riders.

Since it is more likely to be used by high-income people who are now more likely to work at home, rail transit’s recovery is lagging behind bus transit.
Although bus ridership has done better, not all buses are alike. Two modes of transit that were especially hard hit by the pandemic were commuter bus and commuter rail, both of which were designed to bring commuters into downtowns from wealthy suburbs, commuters who are most likely to work at home today.

Commuter buses (CB) have done poorly relative to conventional bus (MB), bus-rapid transit (RB), and trolley buses (TB).
Most of those high-income former transit commuters are likely to continue working at home at least two days a week in 2022 and beyond. Many of them will move further away from work since commuting only two or three days a week will not be so onerous as five days a week. That means they are less likely to ride transit even on the days they do work in an office.
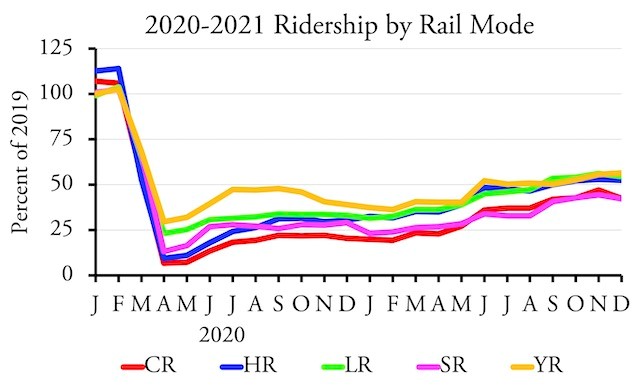
Commuter rail (CR) has also done poorly relative to heavy rail (HR), light rail (LR), and hybrid rail (YR). Streetcars haven’t done well either, partly because many cities have reduce their operations during the pandemic.
Equally devastating to transit is the movement of jobs out of downtowns, the heart of most transit hub-and-spoke systems and the destination of nearly half of transit commuters. Last week, Merrill Lynch announced it was vacating five floors of a downtown San Francisco office building. The company joins many others that have moved away from downtown San Francisco, leaving behind 7.5 million square feet of office space, enough for 40,000 to 50,000 employees.
Big-city downtowns across the country are experiencing similar departures and high vacancy rates. While many of those offices may eventually be leased out, they will be leased at lower rates, and at lower rates the lessees are likely to allow more square footage per worker, meaning downtowns will still have fewer total workers.
As a result, it is unlikely that transit will be able to recover most of its riders by the end of 2022. Transit expert Steve Polzin once estimated that transit would get back 90 percent of its riders by March 2022, but that’s clearly not going to happen. My own prediction was that transit would never recover more than 75 percent of 2019 ridership, and even that seems optimistic today.
Editor’s Note: In Part 2, O’Toole takes a deep dive into the urban transit scene and some solutions for current transit funding issues.
Randal O’Toole, writer of The Antiplanner website, is an economist with forty-five years of experience critiquing public land, urban, transportation, and other government plans.

